Guide
A complete guide to churn reduction with machine learning
In this tutorial, I will guide you through the whole process of creating a machine learning model to reduce your churn. We will go from the analyzis of the data we have to the evaluation of the models we created and taking action to target your risky customers.
Prerequisite: Before we go any further, it will be easier for you to understand this guide if you are somewhat familiar with Python. Don't worry, no technical skills are needed as all the scripts will be available to you on this page.
Table of contents
- Who am I and why am I writing this guide?
- Our data and our goals
- Data cleaning
- Data analyzis
- Choosing your machine learning model
- Taking action
1. Who am I and why am I writing this guide?
I'm Victor Finkelstein, a data scientist and I recently created ChurnTarget to help SaaS reduce their churn. With ChurnTarget, I help companies by analyzing their customers' data and creating custom machine learning models to predict which users are at risk of churning. I wanted to create this guide because I believe a lot of companies could reduce their churn, even by a low number, with machine learning but don't do it because they don't know how to do it or don't have the time. What's really great about churn is that a small reduction can lead to massive results in the future. Here is a quick example:
Let's say that you have 1000 clients and you are losing 3% of them every month. Each client gets you $100 per month. It means that you are losing 30 customers per month (worth $3000 per month). Now let's assume that you just started to use a model to predict your risky users and managed to reduce your churn to 2.5%, during the first month, you already earned $500 but these customers will be bringing you money for the following months as well. This compound effect can represent thousands and thousands of dollars for your company.
Now we can dive straight into our guide.
2. Our data and our goals
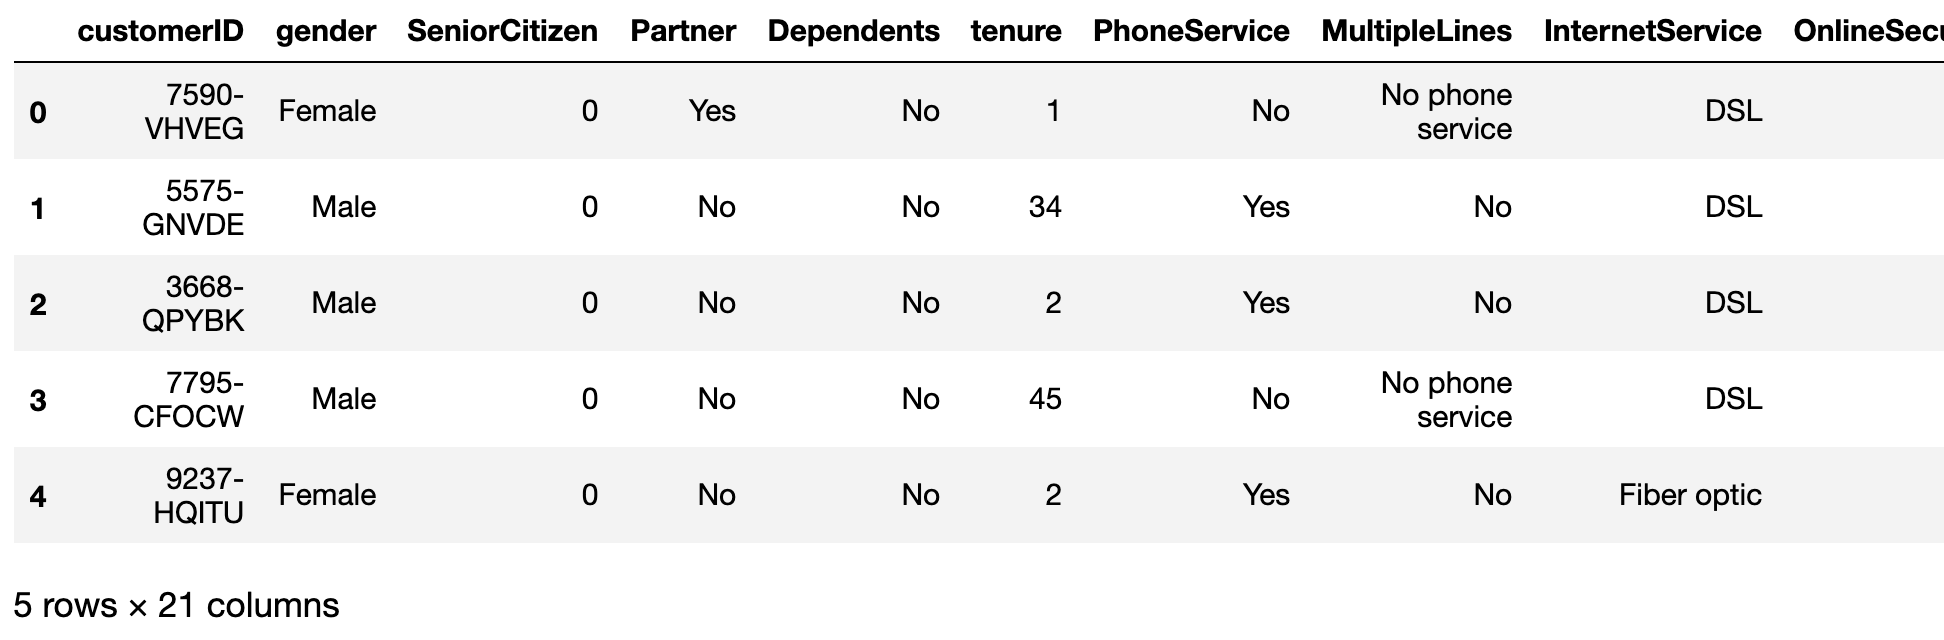
For this guide, we will use a well-known churn dataset: the Telco Customer Churn dataset, available here. This dataset is composed of around 7000 rows, each representing a customer, with each column containing the customer's attributes.
Using this dataset, we want to know which customers are more likely to churn in the following months. To do this, we have different information about each of them, including private information such as their gender, but also information about their usage of the telecom service such as their tenure or the customer's internet service provider.
Having this kind of information as a company can be a huge bonus as it can be used to develop focused customer retention programs.
Before we even begin writing code, we will need the following python packages: pandas, xgboost, matplotlib, seaborn and sklearn,
import pandas as pd
import seaborn as sns
import matplotlib.pyplot as plt
from sklearn.model_selection import train_test_split
from sklearn.linear_model import LogisticRegression
from xgboost import XGBClassifier
from sklearn.ensemble import RandomForestClassifier
from sklearn.metrics import confusion_matrix
from sklearn.metrics import recall_score
from sklearn.metrics import accuracy_score
from sklearn.metrics import precision_score
Now that we know what we want and have the right tools to work, we can dive into probably the most important part of a machine learning problem.
3. Data cleaning
That's right! The most important part about creating a machine learning model is not the model itself but cleaning, preparing, and analyzing the data we will use. To understand why this part is so important, a lot of data scientists like to say that machine learning models follow this rule: Garbage in, garbage out. This is pretty self-explanatory: if you feed poorly cleaned or irrelevant data to a model, you can't expect your predictions to be good.
Before analyzing our data, we have to be sure nothing's wrong with our file and our data. Basically, it means identifying and fixing (when it's possible) incomplete, inaccurate, or missing part of the data. Let's check our data.
df = pd.read_csv('./WA_Fn-UseC_-Telco-Customer-Churn 2.csv')
And to show all the columns:
df.columns
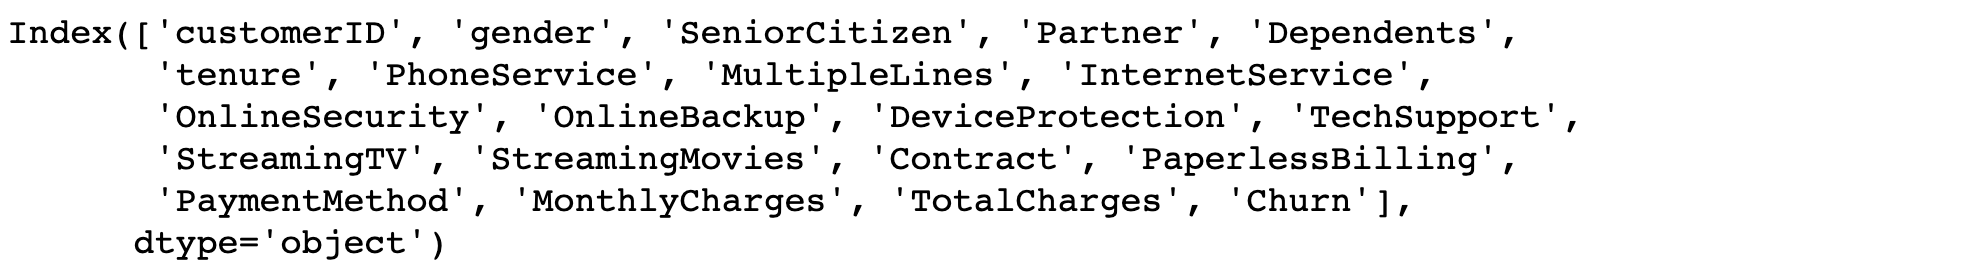
It seems that the column customerID contains a unique ID for each of the customers. To avoid any unpleasant surprise, we better be sure that it is indeed unique and there is no duplicate index in our data. After that, we can make it the index of our dataframe for easier access to the data.
print(df['customerID'].is_unique)
df.set_index('customerID', inplace=True)

Now we can take a look at the type of each column. It may hint us on any anomalies in our data (e.g. strings instead of integers).
print(df.dtypes)
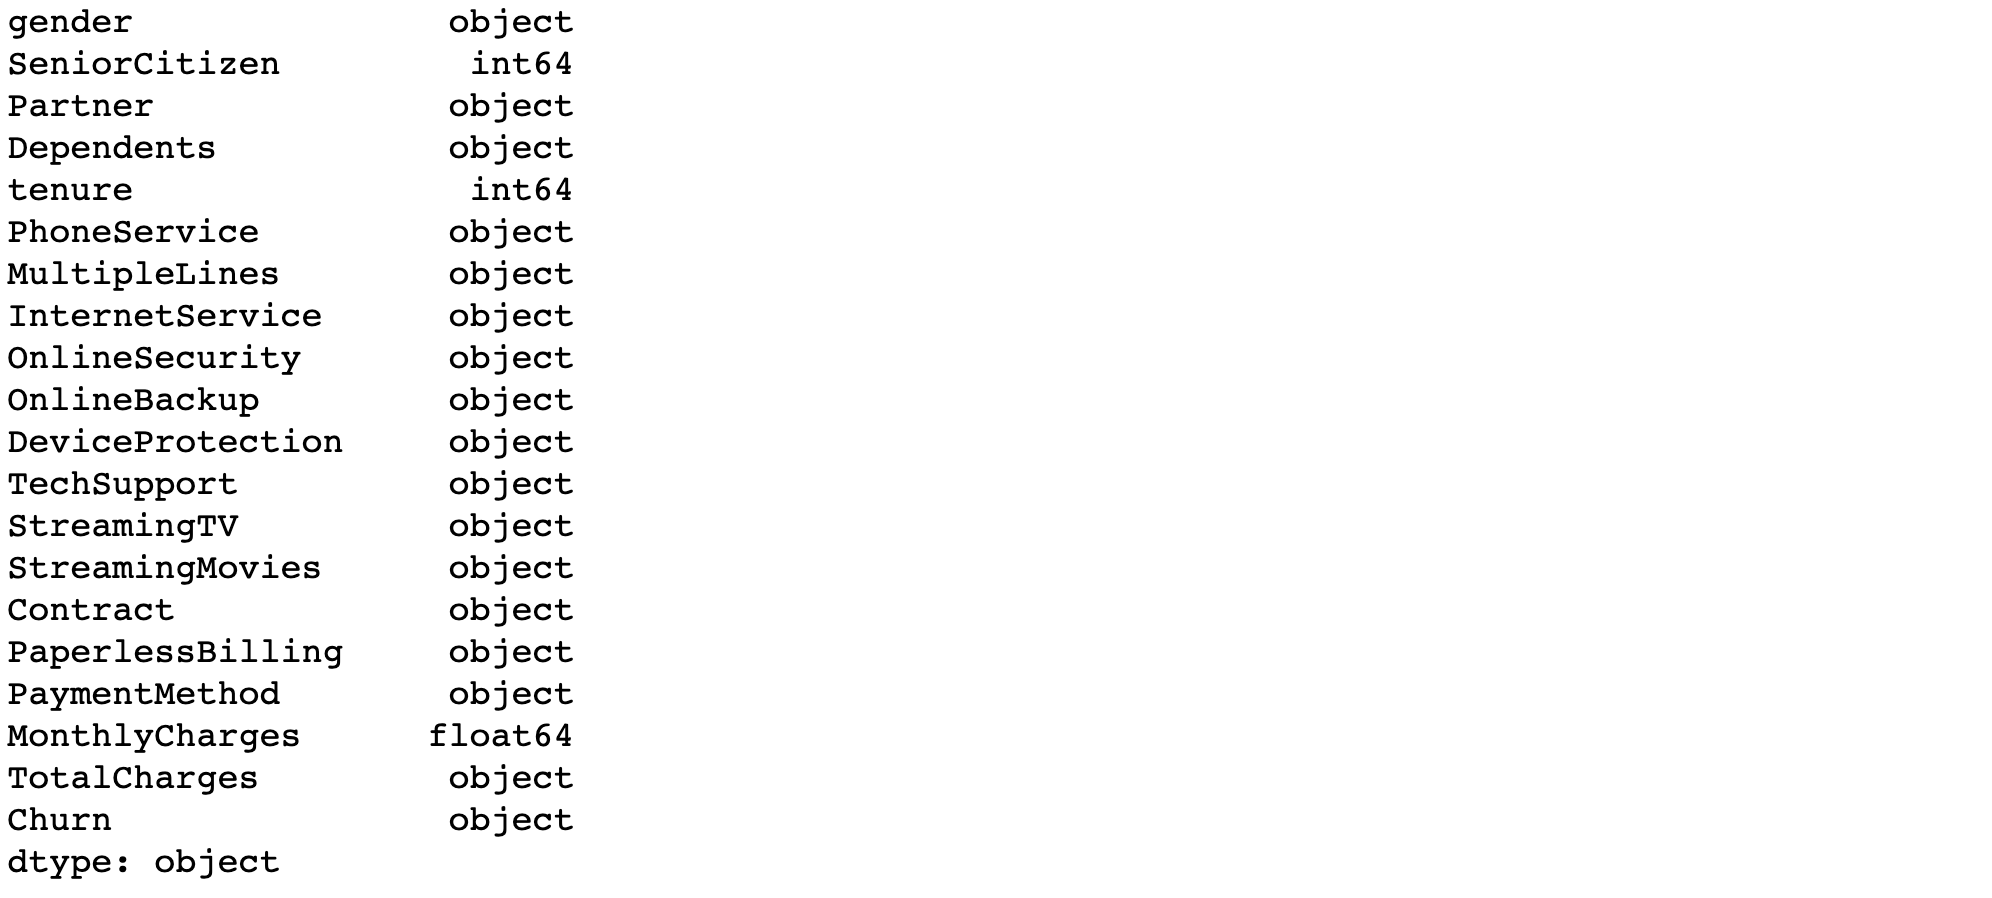
Every column seems to correspond to their type except for TotalCharges that is of type object instead of float64. Let's convert its type.
We will use the argument errors='coerce' to replace every failed conversion by a NaN. By doing this, we can easily spot and fix these errors in the next step.
df['TotalCharges'] = pd.to_numeric(df['TotalCharges'], errors='coerce')
We are using the argument errors='coerce' to replace every failed conversion by a NaN. By doing this, we can easily spot and fix these errors in the next step.
We can now check for missing values in our dataframe.
df.isnull().sum()
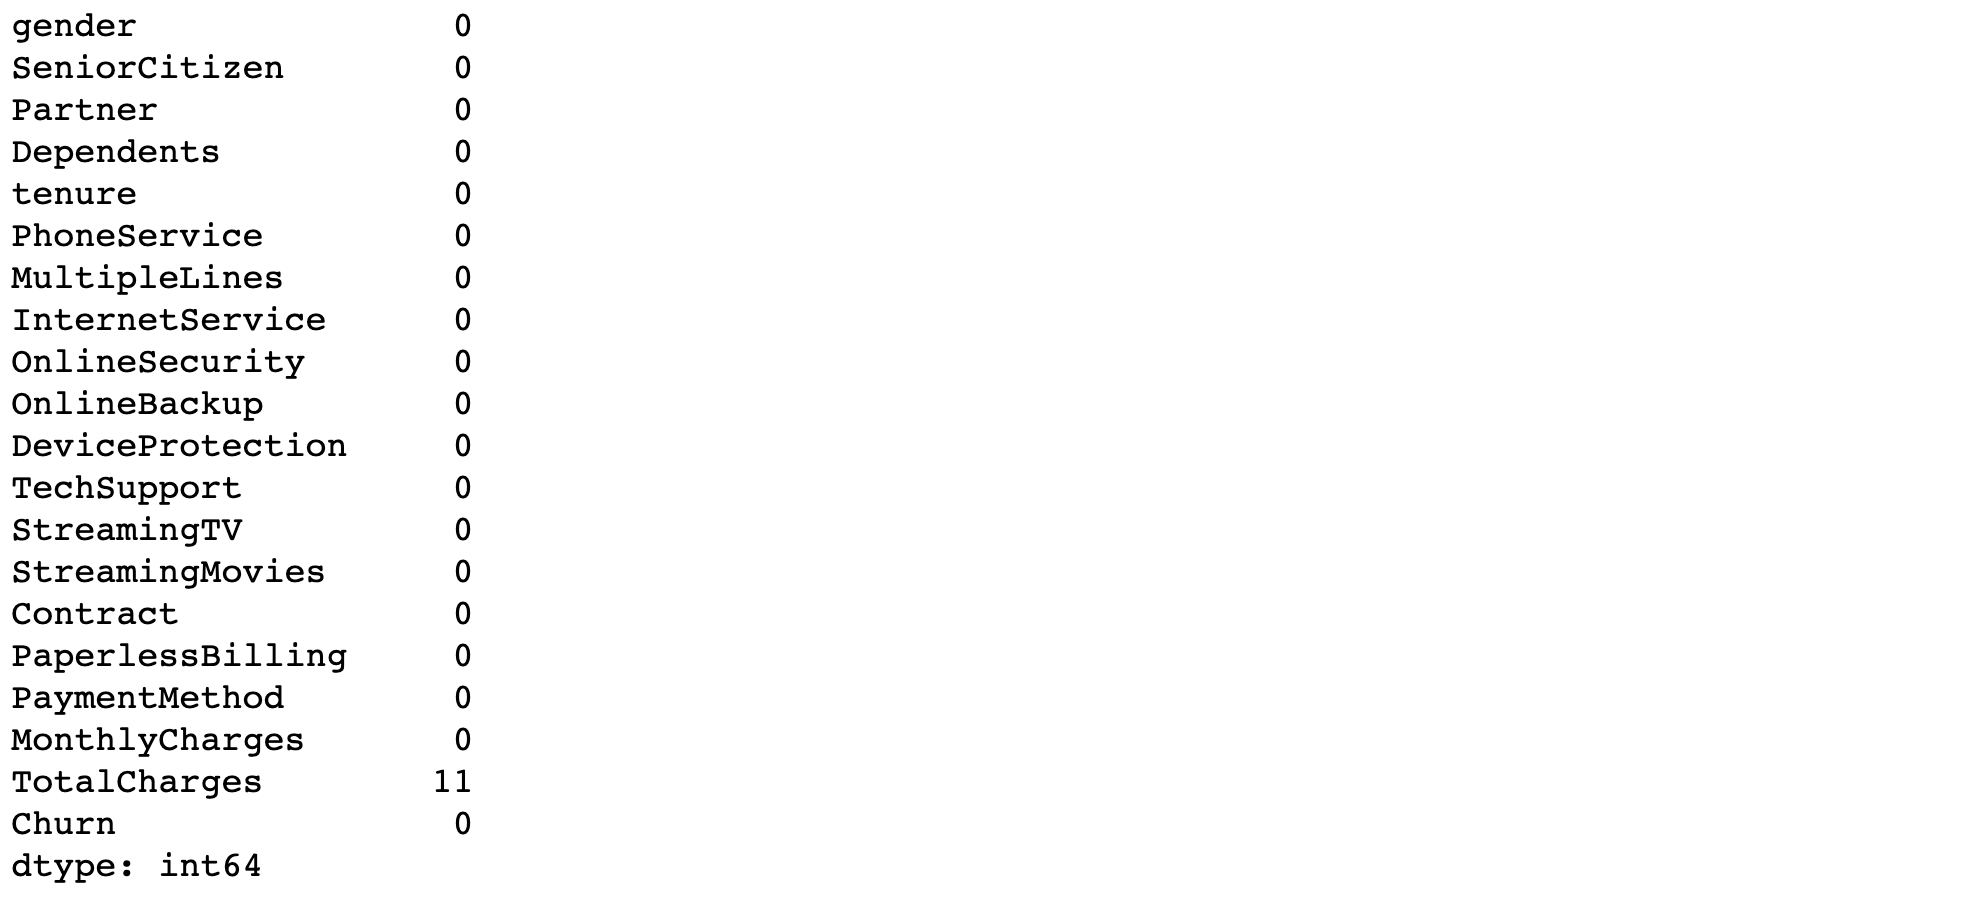
There are only 11 missing values and they all are in the TotalCharges column. It is likely that these NaN come from failed conversion (see the previous step).
We have two choices to deal with these missing values. We could simply remove the lines containing them or try to 'guess' the correct value using the tenure and the MonthlyCharges columns. Computing them this way may lead to wrong 'guesses' since they may have been charged a different amount monthly (due to a change of plan for example). Considering that we have the data of around 7000 customers, we can safely remove them from the dataset without changing the result of the modeling phase.
df.dropna(inplace = True)
Before analyzing the data, we need to convert the churn column into integers and convert all the categorical variables into dummy variables. Dummy variables are a very easy way to convert categorical variables into several 0-1 variables. Some analyzis and models can't deal with categorical variables, hence the need to use dummy variables.
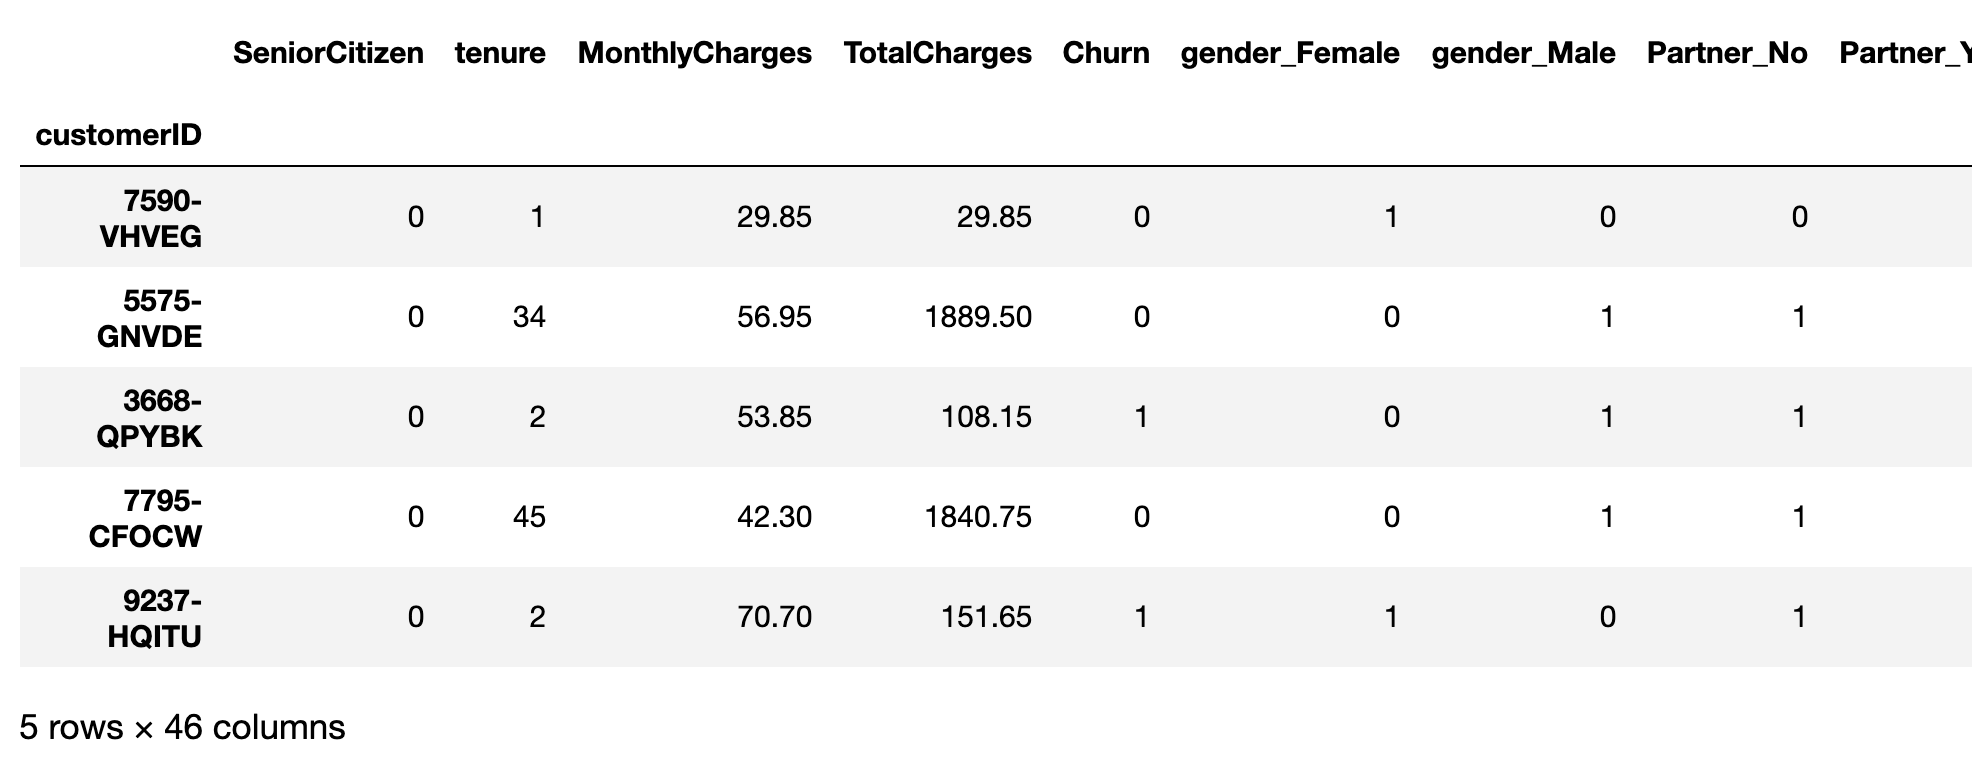
Take a quick look at the data to understand the changes.
df['Churn'].replace('Yes', 1, inplace=True)
df['Churn'].replace('No',  0, inplace=True)

df_dummies = pd.get_dummies(df)
print(df_dummies.head())
4. Data analyzis
Before moving into the data analyzis, you should note that the following analyzis depends mostly on the business' data you are analyzing. Data of an e-commerce shop and of a telecom company for example will be very different. However, if you understand what we are doing in this part, you won't have any problem adapting your analyzis for different data.
Another thing to note is that we won't be doing an exhaustive analyzis of the data as this will be too long and may not be of great interest here. As a reminder, the goal of this guide is to give you the keys to perform such work yourself.
Now that the data is clean, we are ready to analyze it and find valuable information and correlations. One thing that is important when you are analyzing data, is that everything you are doing and finding must make sense. Let's see that in the following steps.
First, we can look at the correlation between the churn column and the other ones.
plt.figure(figsize=(15,8))
df_dummies.corr()['Churn'].sort_values(ascending = False).plot(kind='bar')
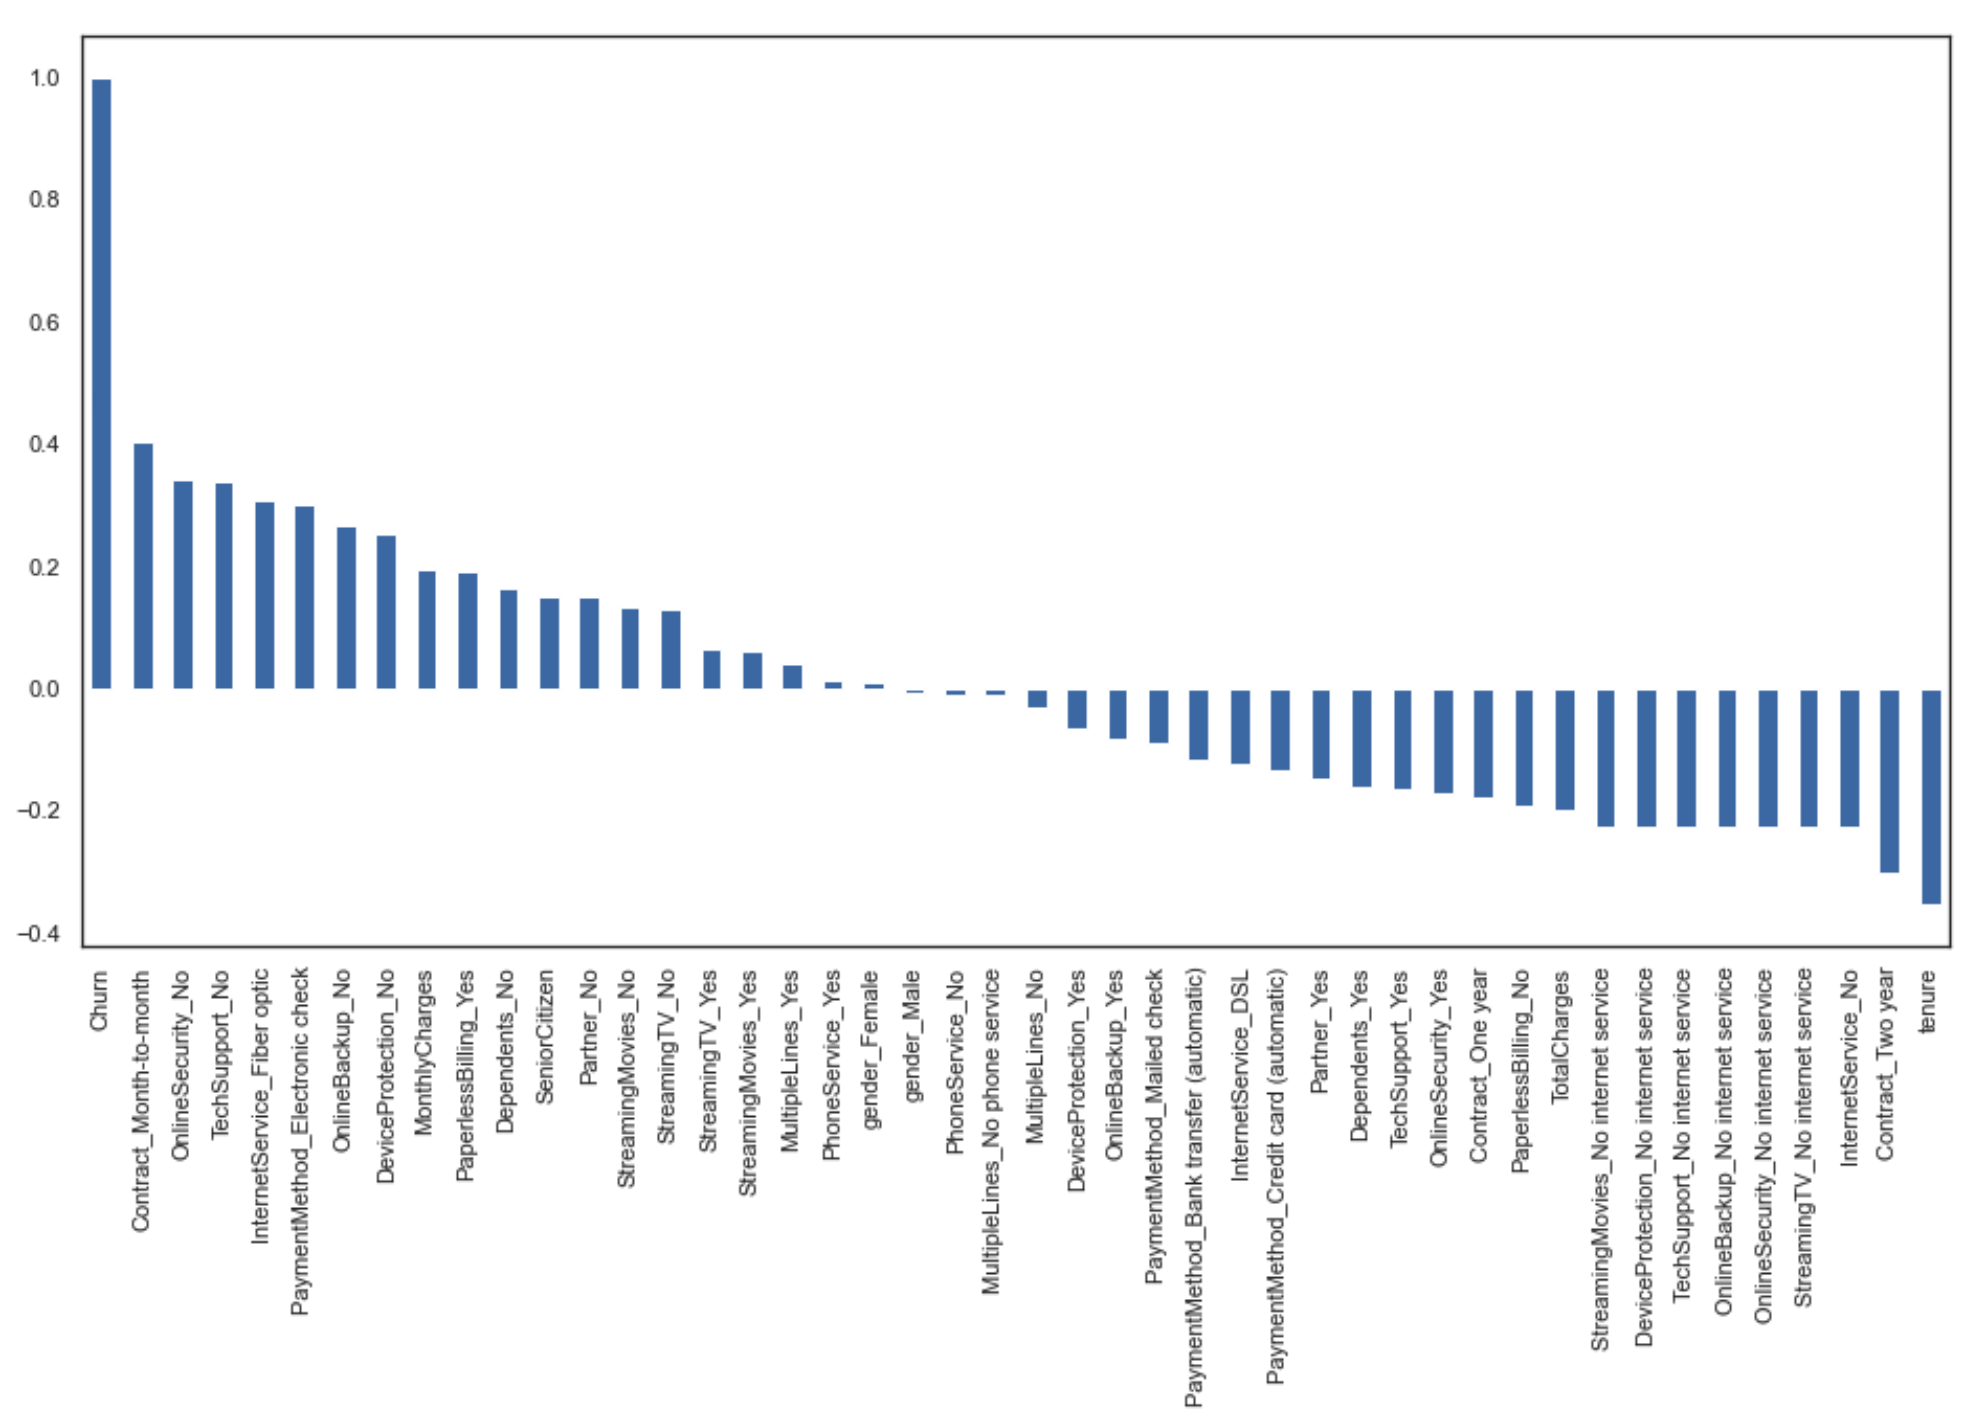
This kind of graph is very interesting, here are some of the main information we can get from this:
- Contract_Month-to-month and OnlineSecurity_No are the most positively correlated columns with churn
- Contract_Two year and tenure are the most negatively correlated columns with churn
- gender_Male and gender_Female don't seem to be correlated with churn
This makes sense as customers with month to month contract will be more likely to churn than customers with two-year contracts. Furthermore, the customer's gender doesn't have any impact on churn in this kind of business.
Let's take a deeper look at the churn column and how other variables interact with it.
sns.displot(df['Churn'], stat="probability")
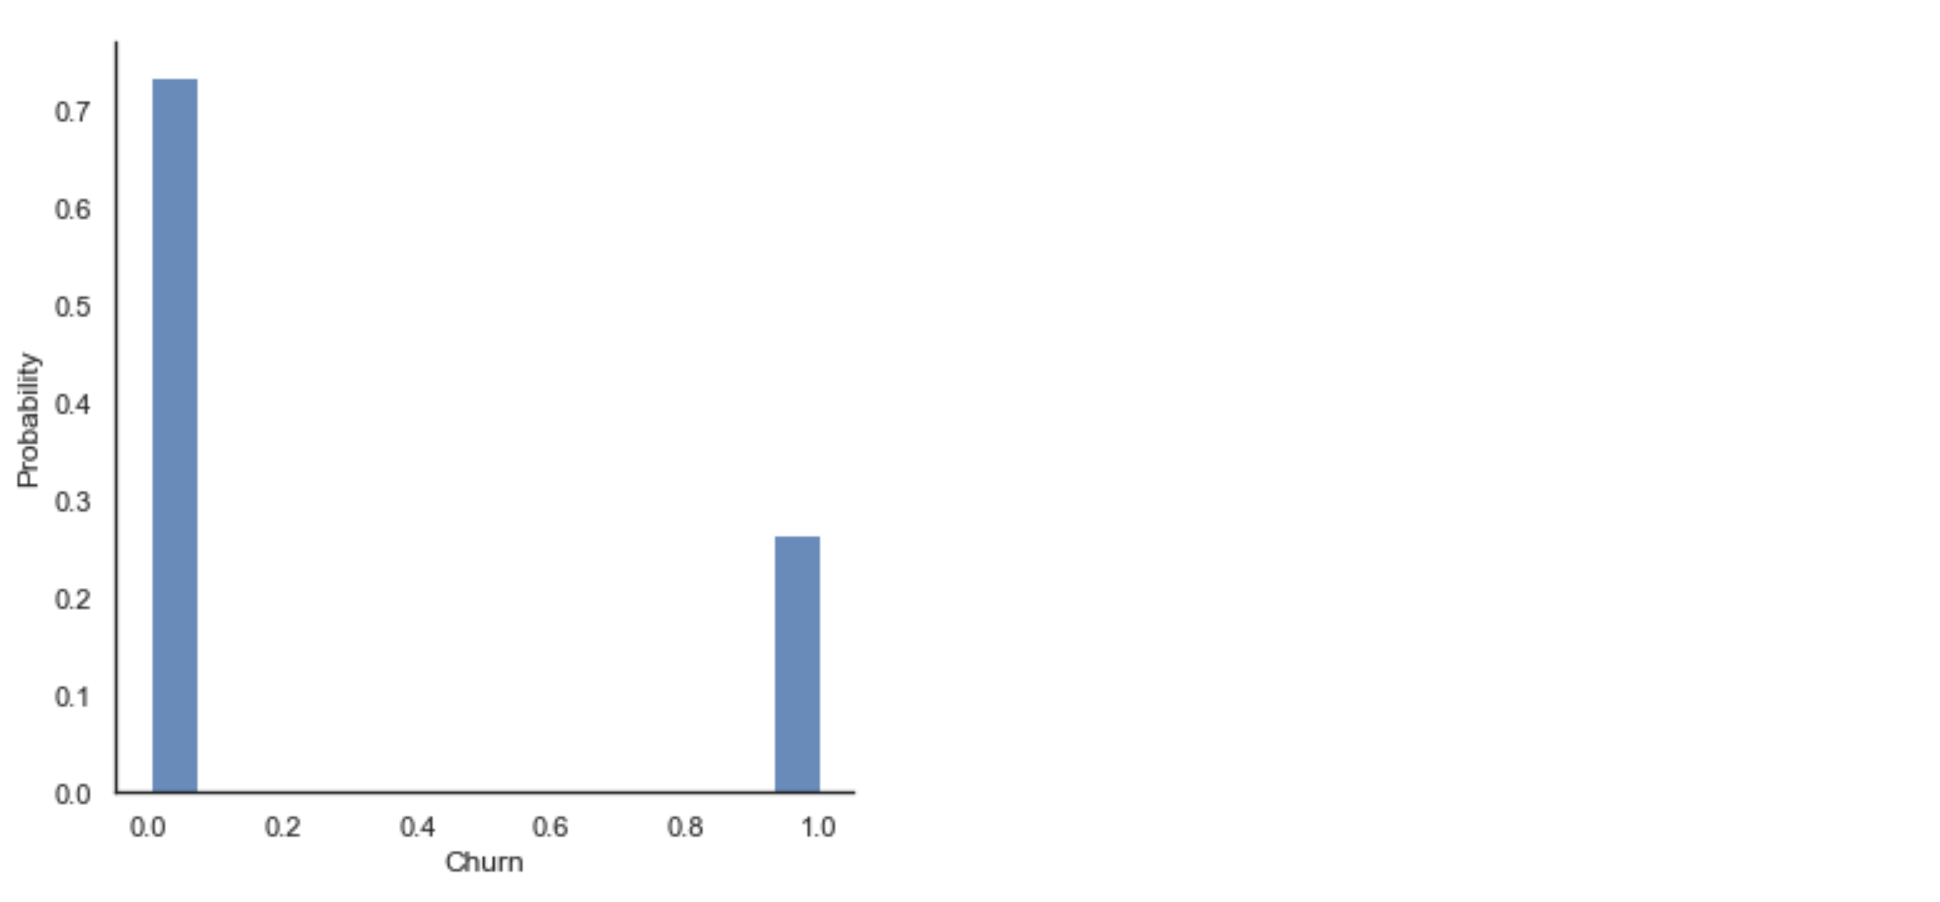
We can see that a quarter of the customers have churned in this dataset. We may have to be careful here because the data seem to be biased towards the churn group. This can induce errors when we train the model because the model will tend to see more churned customers than it's supposed to, leading to too many false positives.
It's often a good idea to compare the churn rate with other variables. For example, in this dataset, we can look at the churn rate by tenure, contract type, or payment method. As explained before, we will just do this analyzis for a few variables but you can apply the same method to analyze all the other columns.
sns.boxplot(x=df['Churn'], y=df['tenure'])
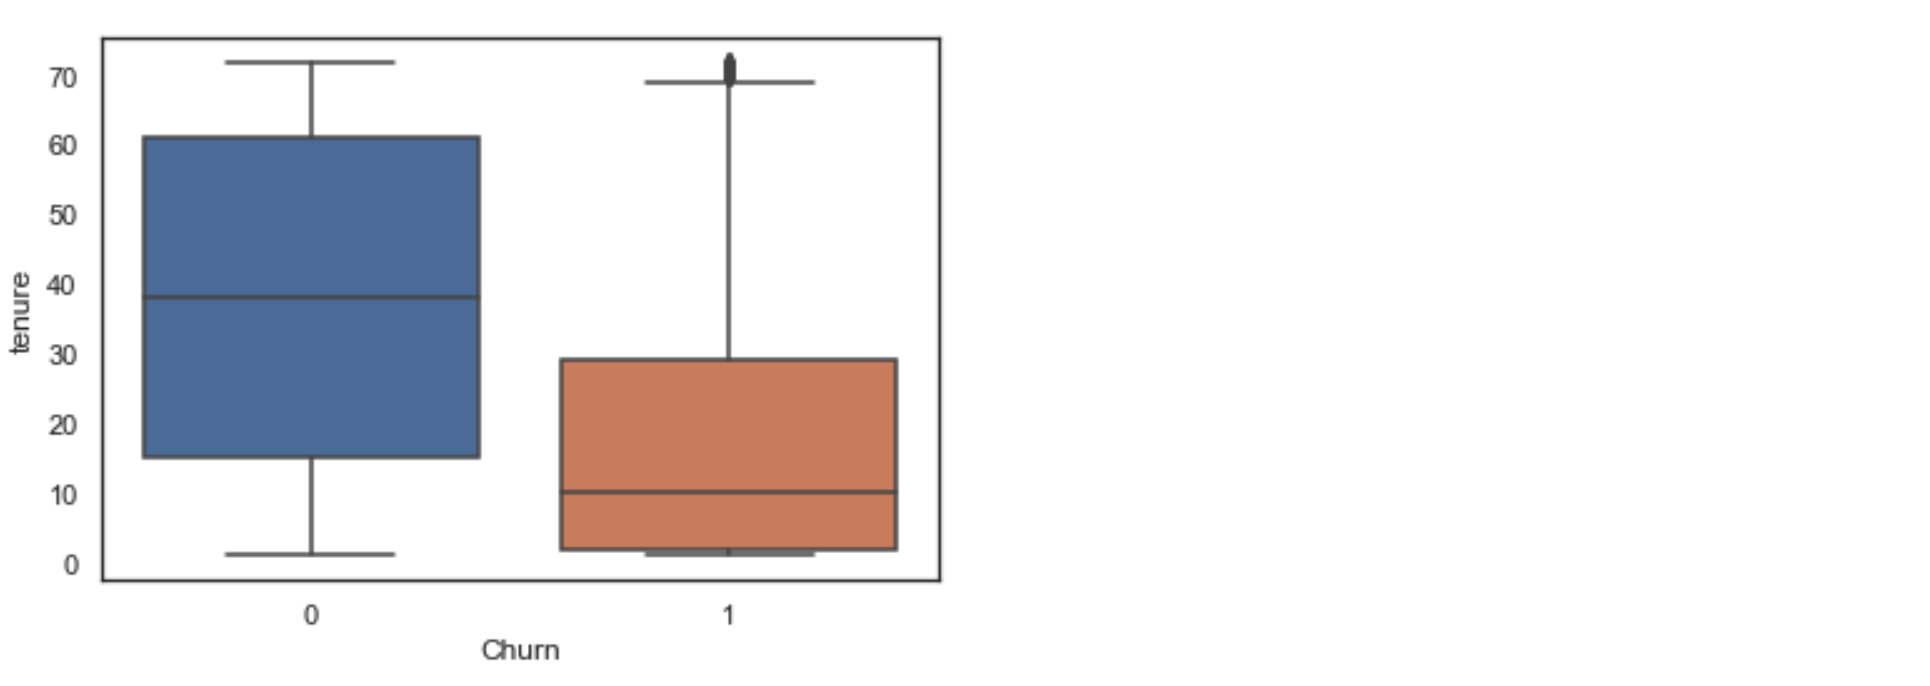
If you're not familiar with boxplots, from the bottom to the top we have: the minimum, the first quartile (the lowest part of the colored box), the median, the third quartile, and the maximum. Any points outside are considered outsiders (like we see above the orange box).
We can see here that (on average) customers who churn tend to be customers that started using their service recently. The median tenure of an 'average' customer is around 40 months while it's around 10 months for churned customers.
groups = df.groupby(['Contract'])
df_month_to_month = groups.get_group('Month-to-month')
df_one_year = groups.get_group('One year')
df_two_year = groups.get_group('Two year')
This code will divide the dataframe into 3 different ones based on the type of contract.
total = df_month_to_month.shape[0]
churn = df_month_to_month[df_month_to_month['Churn'] == 1].shape[0]
print('Percentage of churn in month to month contracts:', round(churn*100/total, 1), "%")

total = df_one_year.shape[0]
churn = df_one_year[df_one_year['Churn'] == 1].shape[0]
print('Percentage of churn in one-year contracts:', round(churn*100/total, 1), "%")

total = df_two_year.shape[0]
churn = df_two_year[df_two_year['Churn'] == 1].shape[0]
print('Percentage of churn in two-year contracts:', round(churn*100/total, 1), "%")

These results are also really interesting even if they were somewhat predictable. We can see that churn is strongly tied to the type of contract the customer has. As expected, churn is mostly present in month-to-month contracts.
Using the exact same method for the payment method, we get the following results:

Here we can see that people that are paying with electronic checks are more likely to churn than customers who pay with other payment methods.
The idea of data analyzis is to understand the main trends behind our data. After that, we want to be able to describe the average churned customer. Once we know which variables have an impact on the churn column, we can begin to create an accurate model.
5. Choosing your machine learning model
Let's get into the modeling part now. We will compare different algorithms and choose the most accurate one.
The first thing we have to do is divide our dataset between the training part and the testing part. The training part is, as the name suggests, to train the model, while the testing part is to evaluate its accuracy.
x_train, x_test, y_train, y_test = train_test_split(x, y, test_size=0.2, random_state=30)
With the above parameters, we use 20% of the dataset for the accuracy test.
We will now evaluate 3 different algorithms.
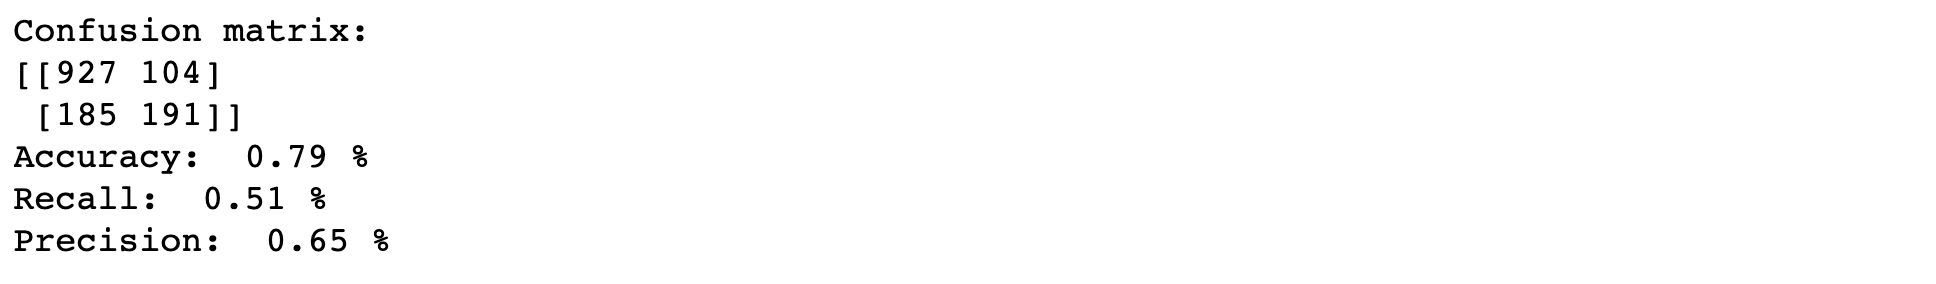
model_lr = LogisticRegression()
result = model_lr.fit(x_train, y_train)
prediction_test = model_lr.predict(x_test)
print("Confusion matrix:")
print(confusion_matrix(y_test, prediction_test))
print("Accuracy: ", round(accuracy_score(y_test, prediction_test),2), "%")
print("Recall: ", round(recall_score(y_test, prediction_test),2), "%")
print("Precision: ", round(precision_score(y_test, prediction_test),2), "%")
We will discuss the results after testing the next 2 algorithms.
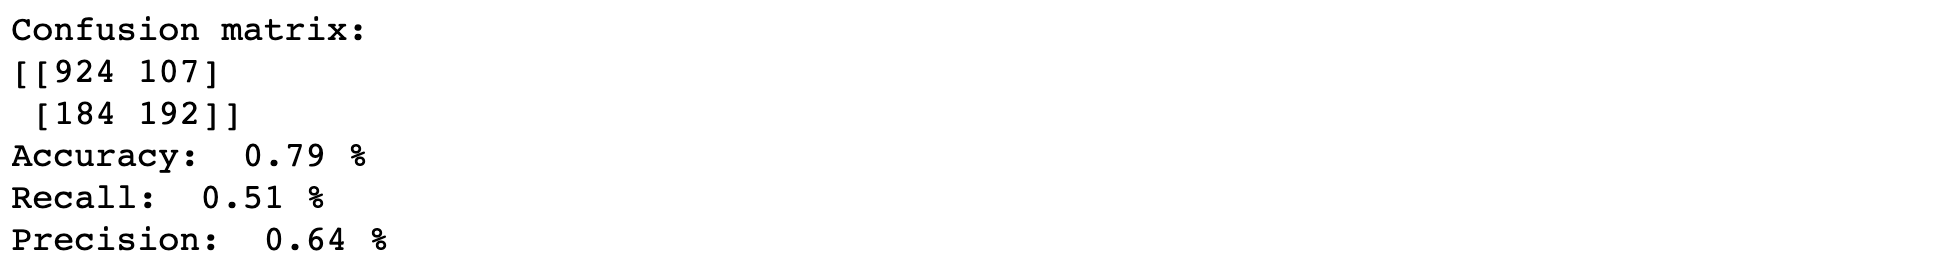
model_rf = RandomForestClassifier()
model_rf.fit(x_train, y_train)
prediction_test = model_rf.predict(x_test)
print("Confusion matrix:")
print(confusion_matrix(y_test, prediction_test))
print("Accuracy: ", round(accuracy_score(y_test, prediction_test),2), "%")
print("Recall: ", round(recall_score(y_test, prediction_test),2), "%")
print("Precision: ", round(precision_score(y_test, prediction_test),2), "%")
model_xgb = XGBClassifier()
model_xgb.fit(x_train, y_train)
prediction_test = model_xgb.predict(x_test)
print("Confusion matrix:")
print(confusion_matrix(y_test, prediction_test))
print("Accuracy: ", round(accuracy_score(y_test, prediction_test),2), "%")
print("Recall: ", round(recall_score(y_test, prediction_test),2), "%")
print("Precision: ", round(precision_score(y_test, prediction_test),2), "%")
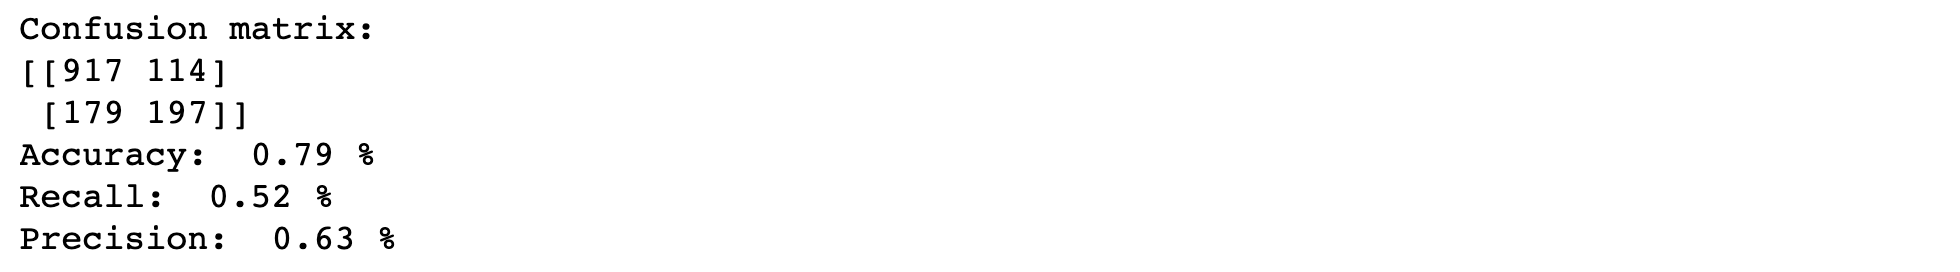
We used 3 algorithms: logistic regression, random forest, and xgboost. I won't explain how they work because it's not the purpose of this guide but we will talk about the results we can see.
The first thing shown in the pictures is a confusion matrix. It works as shown in the image below.
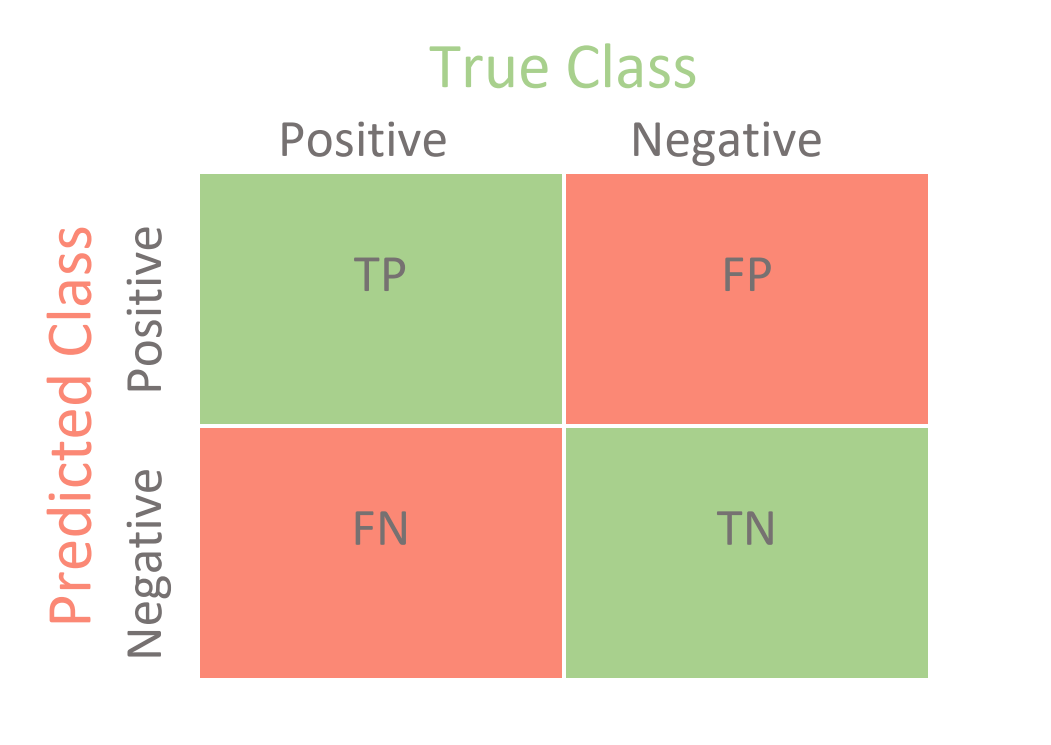
For example, for the xgboost model, we predicted 197 churned users correctly but labeled 114 customers as churned users incorrectly (false positive).
Without computing the accuracy or other metrics, the confusion matrix allows you to have a quick glance at the overall performance of the model.
Right after that, we have 3 important metrics:
- Accuracy: it's the number of correct predictions divided by the total number of predictions. Accuracy is a metric that shows the 'overall' accuracy of the model, without taking into account any imbalance within the dataset (in our case, 25% of positives against 75% of negatives). This metric alone is often not enough to tell you if a model is good or not.
- Recall: it's the number of relevant (true positives here) predictions divided by the total number of actual positives.
- Precision: it's the number of relevant (true positives here) predictions divided by the total number of positives predicted.
Will Koehrsen explains the difference between recall and precision very well in its article. While recall expresses the ability to find all relevant instances in a dataset, precision expresses the proportion of the data points our model says was relevant actually were relevant.
Let's take a look at these 3 metrics for our models. As you can see, the 3 models are very close for our dataset. To choose a model, you have to think about what kind of predictions is the best for your use case: is it better to predict correctly more positives, even if it means having more false positives? Imagine that you're building a model to predict breast cancer. The cost of missing one breast cancer is way higher than the cost of incorrectly predicting cancer for a healthy patient.
But what about our churned users? It also depends on the kind of business you have and several factors such as LTV, customer's lifespan, and the cost of 'saving' a customer. If your customers have a very high lifetime value, it might be worth it to spend some time and money to try to save them, even if some users weren't actually at risk of churning. For this company, having a high recall will be important, in order to identify the most risky users as possible. In other companies, the efforts to save a customer might result in a net loss instead of a benefit in the end. Like everything, you have to find the right balance.
6. Taking action
Sure, creating a machine learning model can be fun but it's even better if the results can help your business!
Now that you created a model that fits your needs, you have to know how to exploit the results.
The first step after you have your predictions is to make them useful. You have a list of customer IDs that your model considers at risk of churning. Upload these results on your CRM or any other similar tools you are using. For example, create a new attribute on your CRM for each customer named 'churn_risk'. In this attribute, put 'High' for customers marked by your model, 'Low' for the others.
This will allow your customer support team to have access to this information in a simple click or while chatting with your users.
The next step is to take action before the risky customers even contact you or churn (because it's most of the time too late). Again, keep in mind that it heavily depends on your business.
There are a lot of things we could do to try to save these customers from leaving. The best thing to do is to define a list of actions to take for each customer (that can depend on the type of service he uses).
The quickest option is to send an email or a text message to every risky customer. In this email, one could tell the customer to answer a short survey to know his opinion about the service. It's also possible to try to sell similar services (e.g. sports streaming service for Telco) in this email.
Another option that could feel more personal is to call each risky customers and do the same process as in the email. Be careful though, calling several times a customer might feel like being spammed and will most likely convince him to quickly churn instead of the other way around.
One last option that could work (although temporarily) is to offer discounts. This might push risky users to stay longer before actually churning. This strategy can work only if the discount doesn't eat up your margin but it can be a good little boost to your customer's LTV.
Improving our model
In this guide, I tried to keep things as simple as possible. I didn't talk about a lot of things that can be useful to improve your model or evaluate it such as hyperparameters tuning, ROC curves, cross-fold validation, etc. Even without this, you should be able to create a basic model that predicts churn thanks to this guide. If this is a topic that might interest you, feel free to reach out to me and I can write about this when I have some time.
Conclusion
From data cleaning to taking action, you now have everything you need to start reducing churn at your company. As I mentioned before, I did this work for several companies previously with ChurnTarget so feel free to register there and I'll be in contact with you to help you set-up a solution for your churn!